Profiling a Confluence server, which has been locally started via the Atlassian SDK, should be straight forward. Start the server, attach the Java VisualVM and you are done. Unfortunately, when trying to instrument the classes deployed to the server for CPU profiling, the following exception is thrown on the console:
Caused by: java.lang.NoClassDefFoundError:
  org/netbeans/lib/profiler/server/ProfilerRuntimeCPUFullInstr
Code snippets with added newlines
Code snippets shown in this article have added newlines for readability.
What seems to tell that a required class is not provided is actually a complaint that the OSGi subsystem has not been configured properly.
Add the following lines to specify a profile with additional system properties to your Maven POM to configure Confluence:
<profile>
  <id>profiling</id>
    <build>
      <pluginManagement>
        <plugins>
          <plugin>
            <groupId>com.atlassian.maven.plugins</groupId>
            <artifactId>maven-confluence-plugin</artifactId>
            <version>6.3.21</version>
            <extensions>true</extensions>
            <configuration>
              <systemPropertyVariables>
                <atlassian.org.osgi.framework.bootdelegation>
                  org.netbeans.lib.profiler.*,sun.*,com.sun.*
                </atlassian.org.osgi.framework.bootdelegation>
                <atlassian.org.osgi.framework.system.packages>
                  org.netbeans.lib.profiler.server
                </atlassian.org.osgi.framework.system.packages>
            </systemPropertyVariables>
          </configuration>
        </plugin>
      </plugins>
    </pluginManagement>
  </build>
</profile>
Start the Confluence server locally using the Atlassian SDK:
atlas-debug -Pprofiling
Then add a configuration via the Java VisualVM's UI to limit instrumentation to classes you want to take execution performance measurements:
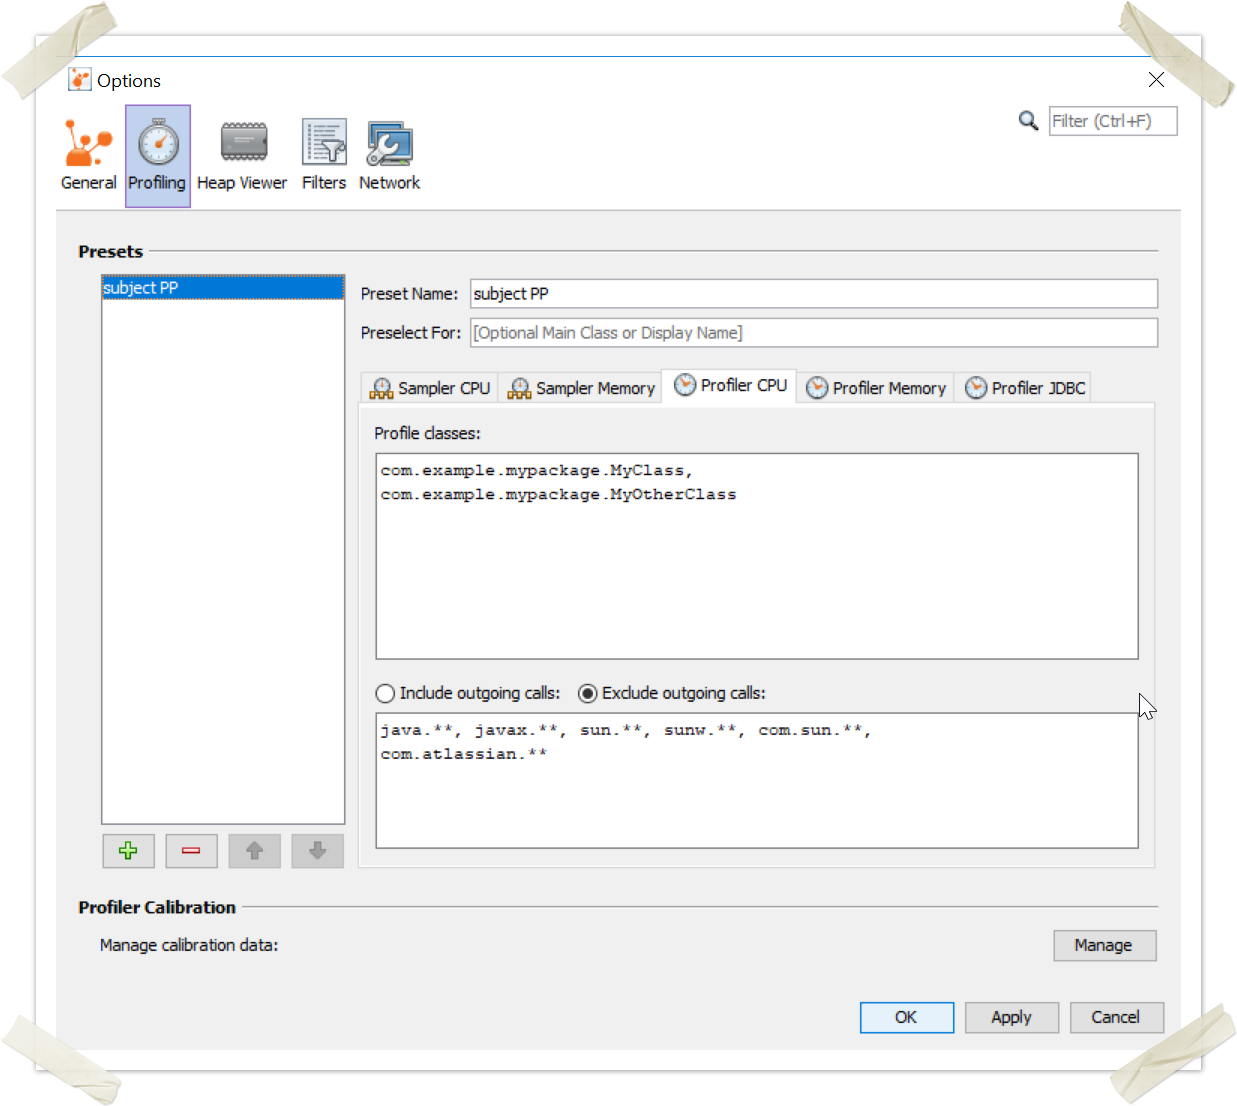
Finally start the instrumentation!
Finding the system property names took me some time, so hopefully this blog article shortens the time of searching for others.