The Chart Macro makes rendering charts in Confluence very easy. Well, sort of – the configuration has a lot of options. One option is to render time series. This is quite useful to render tabular date data, e.g. in software development projects.
The data tables may be hand-crafted or calculated on demand. The second option is especially interesting, if you continuously add new documents with metadata you want to render in a chart. This article shows you how to do this!
Example: Track Journal Data
For instance you may track your excitement or mood documented in your journal or developer diary. Something you may know as Niko-niko, but as a graph.
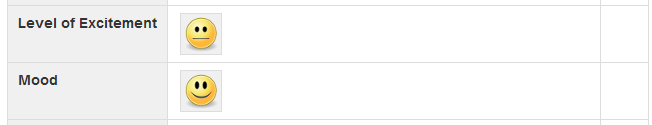
In your diary you create one page in your wiki for every day of work. Besides interesting information you gathered on that day, you may also track your excitement at the beginning and your actual mood at the end of that day.
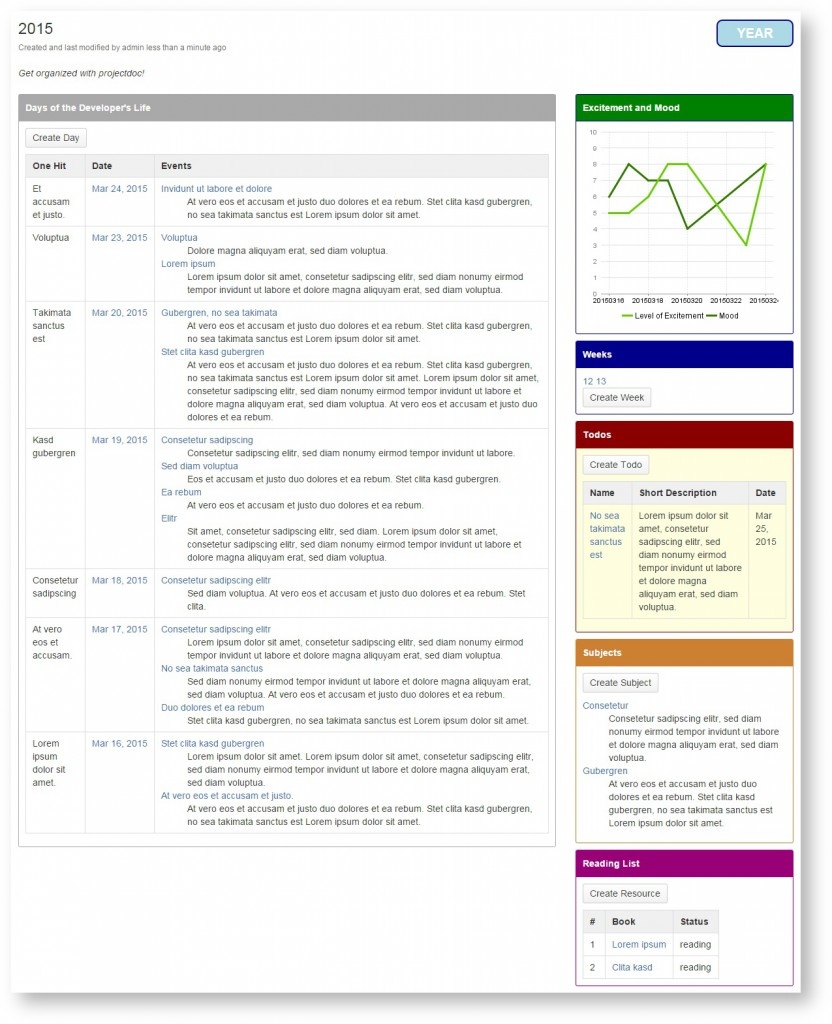
The free Developer Diary Add-on for the commercial projectdoc Add-on for Confluence use the Chart Macro (green panel, upper right) on the diary year page to render the excitement and mood tracked by a developer:
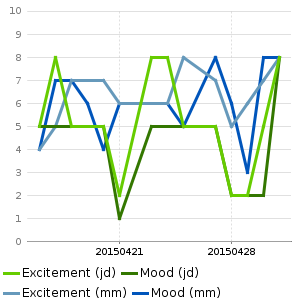
Example: Track Team Data
If you want to track the excitement and mood of your team, the Chart Macro makes this task very easy. Simply add a separate table for each of your team members. There is only one catch: Make sure that each column provides a unique name!
Here is an example that uses the Chart Marco (provided with every Confluence installation by default) and the Display Table Macro (provided by the projectdoc Add-on):
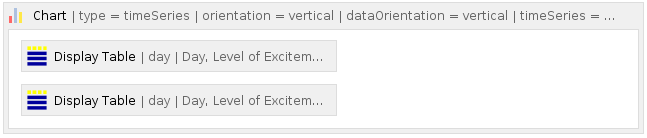
As you can see in the screen shot above: you have to add a Display Table Macro for each of your team members in the body of the Chart Macro.
Here are some details of the configuration of the macros:
<ac:structured-macro ac:name="chart">
<ac:parameter ac:name="orientation">vertical</ac:parameter>
<ac:parameter ac:name="timePeriod">Day</ac:parameter>
<ac:parameter ac:name="dataOrientation">vertical</ac:parameter>
<ac:parameter ac:name="timeSeries">true</ac:parameter>
<ac:parameter ac:name="colors">#66CC00, #337700, #6699BB, #0055BB</ac:parameter>
<ac:parameter ac:name="rangeAxisUpperBound">10</ac:parameter>
<ac:parameter ac:name="rangeAxisLowerBound">0</ac:parameter>
<ac:parameter ac:name="dateFormat">yyyyMMdd</ac:parameter>
<ac:parameter ac:name="type">timeSeries</ac:parameter>
<ac:rich-text-body>
<p>
<ac:structured-macro ac:name="projectdoc-display-table">
<ac:parameter ac:name="sort-by">Sort Key-</ac:parameter>
<ac:parameter ac:name="space-key">
<ri:space ri:space-key="~jane.doe"/>
</ac:parameter>
<ac:parameter ac:name="select">Day, Level of Excitement$, Mood$</ac:parameter>
<ac:parameter ac:name="header-translations">Level of Excitement$=Excitement (jd), Mood$=Mood (jd)</ac:parameter>
<ac:parameter ac:name="suppress-images">true</ac:parameter>
<ac:parameter ac:name="max-hit-count">14</ac:parameter>
<ac:parameter ac:name="where">$<Author> = [Jane Doe]</ac:parameter>
<ac:parameter ac:name="doctype">day</ac:parameter>
</ac:structured-macro>
</p>
<p>
<ac:structured-macro ac:name="projectdoc-display-table">
<ac:parameter ac:name="sort-by">Sort Key-</ac:parameter>
<ac:parameter ac:name="space-key">
<ri:space ri:space-key="~mike.mark"/>
</ac:parameter>
<ac:parameter ac:name="select">Day, Level of Excitement$, Mood$</ac:parameter>
<ac:parameter ac:name="header-translations">Level of Excitement$=Excitement (mm), Mood$=Mood (mm)</ac:parameter>
<ac:parameter ac:name="suppress-images">true</ac:parameter>
<ac:parameter ac:name="max-hit-count">14</ac:parameter>
<ac:parameter ac:name="where">$<Author> = [Mike Mark]</ac:parameter>
<ac:parameter ac:name="doctype">day</ac:parameter>
</ac:structured-macro>
</p>
</ac:rich-text-body>
</ac:structured-macro>
The XML above shows the storage format with the configuration of two tables for two team members. As a user you won’t need to bother with the XML, since you use the graphical interface provided by the macros.
As you can see by the doctype constraint, the Display Table Macro collects the Excitement and Mood properties of all pages created with the Day template provided by the projectdoc Developer Diaries Add-on. The ‘$’ at the end of the selected property names instructs the macro to render the numeric value instead of the icon (as shown in edit mode above).
The rendered result in your page looks like this:
You may define your own templates that provide numeric metadata to be rendered with the Chart Macro quite easily. Simply add another row to your document metadata!
Check out the free add-ons for projectdoc on the Atlassian Marketplace to get you started quickly!
Conclusion
The combination of Chart Macro and the Display Table Macro in combination allow to visualize interesting information contained on pages of your Confluence wiki.
If you create your documentation collaboratively with your team, it is easier to add new information on separate pages. This way each information has its own URL and can be addressed and worked on separately. The Display Table Macro calculates the tables from the metadata on these pages on demand, while the Chart Macro renders them as charts.
For more information on projectdoc and its add-ons refer to
- Developer Diary Add-on (free, but requires projectdoc)
- projectdoc Add-on (commercial add-on for Confluence)
 Or jump directly to the projectdoc add-ons on the Atlassian Marketplace to install a free trial!
On the Getting Started page you’ll find additional video material that introduces you in the concepts of projectdoc.